Slide Design

“I know you can’t read this from the back of the room,” the presenter apologizes while showing a screen so full of words you would think the entire speech had been crammed into one slide. This slide is just the first of a seemingly endless string of slides the audience can’t read, charts so full of numbers they can’t decipher the meaning, and clip art so clichéd they can’t help but roll their eyes and sigh. It is not long before there’s an incredibly dense graph the audience can’t make any sense of. Many audience members are trying to read what’s on the slides, and feel that the speaker keeps interrupting their concentration with actual talking. And many are wondering why the speaker even bothered with the presentation – they could have just emailed a handout.
PowerPoint is ubiquitous, but no matter what presentation platform you use, it’s important to know how to present slides. The phrase “death by PowerPoint” was coined in response to wordy and intellectually deadening presentations that focus on the slides rather than the content or the presenter, often with the speaker reading directly from the slides because the focus is on the slides and not on the act of speaking itself. You can avoid death by PowerPoint by using good slide design.
Slide Design
Slide design has a major impact on your ability to get your message across to your audience. Numerous books address various design fundamentals and slide design, but there isn’t always consensus on what is “best.” What research has shown, though, is that people have trouble grasping information when it comes at them simultaneously through different mediums. “They will either listen to you or read your slides; they cannot do both”[1] ). This leaves you, the presenter, with a lot of power to direct or scatter your audience’s attention.
Below are many points to consider in order to design effective slides.
Audience-Centered Design
First and foremost, design with your audience in mind. Your slide show is not your outline. The slide show is also not your handout. Keep your slides short, create a separate handout if needed, and write as many notes for yourself as you need.
All decisions, from the images you use to their placement, should be done with a focus on your purpose, audience, and context. Each slide should reinforce or enhance your message, so make conscious decisions about each element and concept you include and edit mercilessly.[2] Taking a step further, graphic designer Robin Williams suggests each element be placed on the slide deliberately in relation to every other element on the slide.[3]
Appropriate Information Amount per Slide

Providing the right amount of information, neither too much nor too little, is one of the key aspects in effective communication.[4] If the viewers have too little information, they must struggle to put the pieces of the presentation together. Most people, however, include too much information (e.g., slides full of text, meaningless images, overly complicated charts), which taxes the audience’s ability to process the message. “There is simply a limit to a person’s ability to process new information efficiently and effectively” (Reynolds, 2008, p. 122). As a presenter, reducing the amount of information directed at your audience (words, images, sounds, etc.) will help them to better remember your message.[5] In this case, less is actually more.
One strategy to right-sizing the information is to include only one concept or idea per slide. If you need more than one slide, use it, but don’t cram more than one idea on a slide. While many have tried to proscribe the number of slides you need based on the length of your talk, there is no formula that works for every presentation. Use only the number of slides necessary to communicate your message, and make sure the number of slides corresponds to the amount of time allotted for your speech. Practice with more and fewer slides and more and less content on each slide to find the balance between too much information and too little.
With simplicity in mind, the goal is to have a slide that can be understood in three seconds. Think of a slide as a billboard you are passing on the highway (Duarte, 2010). You can achieve this three-second rule by reducing the amount of irrelevant information in your slide as much as possible. This reduction might include eliminating background images, using clear icons and images, or creating simplified graphs. Your approach should be to remove as much from your slide as possible until it no longer makes any sense if you remove more (Reynolds, 2008).
Visual Simplicity

Aim for a simple, clean look for each slide. Don’t overcrowd your slide with text and images. Cluttered slides are hard to understand. Leaving empty space, also known as white space, gives breathing room to your design. The white space actually draws attention to your focus point and makes your slide appear more elegant and professional.
Using fewer and repeated colors and fonts will help tie all your slides together. This cohesion is especially important if a group is putting visuals together collaboratively. If you have handouts, they should also match this same formatting in order to convey a more professional look and tie all your pieces together[6]
Contrast
Another general principle is to use contrast to highlight your message. Contrast should not be subtle. Make type sizes significantly different. Make contrasting image placements, such as horizontal and vertical, glaringly obvious. A general principle to follow: if things are not the same, then make them very, very different.[7]
Placement of Information on Slides
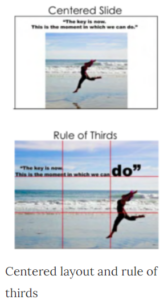
A common layout design is called the rule of thirds. If you divide the screen using two imaginary lines horizontally and two vertically, you end up with nine sections. The most visually interesting and pleasing portions of the screen will be at the points where the lines intersect. Aligning your text and images with these points is preferred to centering everything on the screen.[8] Feel free to experiment with right- and left-aligned content for contrast and interest. Sticking with a centered layout means more work trying to make the slide interesting.[9]
Understanding how people view images (and thus slides) can help you direct the viewer’s attention to the main point of your slide. In languages that read text from left to right and top to bottom, like English-speaking contexts, people tend to also read images and slides the same way. Starting in the upper left of the screen, they read in a Z pattern, exiting the page in the bottom right corner unless their vision is sidetracked by the objects they are looking at.
Viewers’ eyes are scanning from focus point to focus point in an image, so you need to consciously create visual cues to direct them to the relevant information. Cues can be created subtly by the placement of objects in the slide, by showing movement, or more obviously by using a simple arrow (Ma.lamed , 2009). Make sure all people and images of paths (e.g., roads, a car, an airplane) are facing into your slide. When the natural motion or gaze of your images points away from your slide, your viewers look that way too. Be aware of and address the natural tendencies of people when viewing images, so you select can images and design slides that keep the viewer engaged in your message (Duaite, 2008).
Backgrounds and Effects
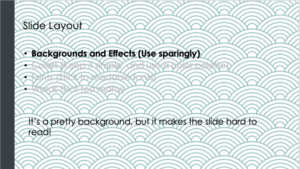
PowerPoint and other slideware have a variety of templates containing backgrounds that are easy to implement for a consistent slideshow. Most of them, however, contain distracting graphics that are counter to the simplicity you are aiming for in order to produce a clear message. It is best to use solid colors, if you even need a background at all. For some slideshows, you can make the slides with full-screen images, thus eliminating the need for a background color.
Should you choose to use a background color, make sure you are consistent throughout your presentation. Different colors portray different meanings, but much of this is cultural and contextual, so there are few hard and fast rules about the meaning of colors. Bright colors, such as yellow, pink, and orange, should also be avoided as background colors as they are too distracting. Black, on the other hand, is generally associated with sophistication and can be a very effective background as long as there is sufficient contrast with the other elements on your slide.[10] Be aware, though, that it is still easier to read black text on a white background than it is to read white text on a black background.
Colors
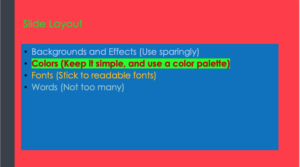
There are complicated and fascinating biological and psychological processes associated with color and color perception, but the focus here is on basic rules and recommendations for working with color in slides.
Much of what we perceive in terms of a color is based on what color is next to it. Be sure to use colors that contrast so they can be easily distinguished from each other. High contrast improves visibility, particularly at a distance, and is more accessible. If you’re concerned about insufficient contrast, try using a contrast checker like this one (opens in new window).
Avoid using red and green closely together. Red-green color blindness is the predominate form of color blindness, meaning that a person cannot distinguish between those two colors. There are other forms of color blindness, and you can easily check to see if your visuals will be understandable to everyone using an online tool such as the Coblis Color Blindness Simulator (opens in new window) to preview images as a color-blind person would see them. Certain red-blue pairings can also be difficult to look at for the non-color blind. These colors appear to vibrate when adjacent to each other and are distracting and sometimes unpleasant to view.
With all these rules in place, selecting a color palette (the group of colors to use throughout your presentation) can be daunting. Some color pairs, like complementary colors or analogous colors, are naturally pleasing to the eye and can be easy options for the color novice. There are also online tools for selecting pleasing color palettes using standard color pairings including Kuler (opens in new window) and Color Scheme Designer (opens in new window). You can also use websites like Colorbrewer (opens in new window) to help identify an appropriate palette of colors that are visually distinct, appropriate for the colorblind, and that will photocopy well, should you decide to also use a handout.
Remember to use high contrast colors. Audience members with low vision or color blindness will appreciate it. And do not use color as the only method for distinguishing information.
Fonts

There are thousands of fonts available today. Despite many beautiful options, it is best to stick to standard fonts that are considered screen-friendly. These mostly include sans serif fonts such as Ariel, Helvetica, Tahoma, or Veranda.[11] These fonts work well with the limitations of computer screens and are legible from a distance if sized appropriately. Other non-standard fonts, while attractive and eye-catching, may not display properly on all computers. If the font isn’t installed on the computer you are presenting from, the default font will be used which alters the text and design of the slide.
Readability is a top concern with font use, particularly for those at the back of your audience, who are furthest from the screen. After you have selected a font, make sure that the font size is large enough for everyone to read clearly. In general, it’s good to make your font at least 24 point. If you have the opportunity to use the presentation room before the event, view your slides from the back of the room. They should be clearly visible. Presentation guru Nancy Duarte describes an ingenious way to test visibility from your own computer. Measure your monitor diagonally in inches, display your slides, then step back the same number of feet as you measured on your monitor in inches. If you have a 17 inch screen, step back 17 feet to see what is legible.[12]
In addition to font style and size, there are other font “rules” to improve your slides. Don’t use decorative, script, or visually complex fonts. And never use the Comic Sans font if you want to retain any credibility with your audience.
If you must use more than one font, it’s o.k. to use one serif font (e.g., Times New Roman) and one sans serif font. Use the same font(s) and size(s) consistently throughout your presentation. Don’t use all upper case or all bold. Avoid small caps and all word art, shadows, outlines, stretching text, and other visual effects. Use italics and underlines only for their intended purposes (for titles or emphasis and URLs respectively), not for design.
Text
Nothing is more hotly debated in slide design than the amount of text that should be on a slide. Godin says “no more than six words on a slide. EVER” (as cited in Reynolds, 2008, p. 20). Other common approaches include the 5×5 rule—five lines of text, five words per line—and similar 6×6 and 7×7 rules. Even with these recommendations, it is still painfully common to see slides with so much text on them that they can’t be read by the audience, since the type has to be small to fit all the words on the slide. Duarte points out that if you have too many words, you no longer have a visual aid. You have either a paper or a teleprompter, and she recommends opting for a smaller number of words.
Once you understand that the words on the screen are competing for your audience’s attention, it will be easier to edit your slide text down to a minimum. The next time you are watching a presentation and the slide changes, notice how you aren’t really grasping what the speaker is saying, and you also aren’t really understanding what you are reading. Studies have proved this split-attention affects our ability to retain information;[13] so when presenting, you need to give your audience silent reading time when you display a new slide. That is, talk, advance to your next slide, wait for them to read the slide, and then resume talking. If you consider how much time your audience is reading rather than listening, hopefully you will decide to reduce the text on your slide and return the focus back to you, the speaker, and your message.
There are several ways to reduce the number of words on your page, but don’t do it haphazardly. Tufte warns against abbreviating your message just to make it fit. He says this dumbs down your message, which does a disservice to your purpose and insults your audience’s intelligence.[14] Instead, Duarte and Reynolds recommend turning as many concepts as possible into images.[15][16] Studies have shown that people retain more information when they see images that relate to the words they are hearing.[17] And when people are presented information for a very short time, they remember images better than words.[18]
The ubiquitous use of bulleted lists is also hotly debated. PowerPoint is practically designed around the bulleted-list format, even though is it regularly blamed for dull, tedious presentations with either overly dense or overly superficial content.[19] Mostly this format is used (incorrectly) as a presenter’s outline. “No one can do a good presentation with slide after slide of bullet points. No One.”[20] Reserve bulleted lists for specifications or explaining the order of processes. In all other cases, look for ways to use images or short phrases.
Quotes, on the other hand, are not as offensive to design if they are short, legible, and infrequently used. They can be a very powerful way to emphasize a point or to launch into your next topic. If you do use a quote in your slide show, immediately stop and read it out loud or allow time for it to be read silently. If the quote is important enough for you to include it in the talk, the quote deserves the audience’s time to read and think about it. Alternately, use a photo related to the concept with a phrase from the quote you will be reading, making the slide enhance the point of the quote.
Transitions
When designing your presentation, it is tempting to show off your tech skills with glitzy transitions, wipes, fades, moving text, sounds, and a variety of other actions. These effects are distracting to your audience and should be avoided. They draw attention away from you and your message, instead focusing the audience’s attention on the screen.
Images
Images can be powerful and efficient ways to tap into your audience’s emotions. In general, limit the number of images on slides.
Use photographs to introduce an abstract idea, evoke emotion, present evidence, or direct the audience attention, as long as they are compatible with and directly illustrate your message.[21] Photos aren’t the only images available. You might consider using simplified images like silhouettes, line art, diagrams, enlargements, or exploded views, but these images should be high quality and relevant. Simplified images can be easier to understand, particularly if you are showing something that has a lot of detail. Simple images also translate better than words to a multicultural audience.[22] In all cases, only choose images that enhance your spoken words and are professional quality. This need for high quality generally rules out the clip art that comes with slideware. Select high-quality images and don’t be afraid to use your entire slide to display the image. Boldness with images often adds impact.

When using images, do not enlarge them to the point that the image becomes blurry, also known as pixelation. Pixelation is caused when the resolution of your image is too low for your output device (e.g., printer, monitor, or projector). When selecting images, look for clear ones that can be placed in your presentation without enlarging them. A good rule of thumb is to use images over 1,000 pixels wide for filling an entire slide. If your images begin to pixelate, either reduce the size of the image or select a different image.
Never use an image that has a watermark on it. A watermark is a logo or text that is placed in a digital image to prevent people from reusing it. It is common for image companies to have a preview available that has a watermark on it. This preview allows you, the potential customer, to see the image but prevents you from using the image until you have paid for it. Instead, select images that are free, from Creative Commons (opens in new window) sources such as www.Pixabay.com or Wikimedia. The creators of images with a Creative Commons License allow others to use their work, according to the description of what is and isn’t allowed in the type of license for each image. Also, images created by the U.S. government and its agencies are copyright free and can be used at no cost.
One final consideration with using images: having the same image on every page, be it part of the slide background or your company logo, can be distracting and should be removed or minimized. As mentioned earlier, the more you can simplify your slide, the easier it will be for your message to be understood.
Videos
If possible, download video clips rather than relying on a Wi-Fi connection, which can be unreliable or require sign-in procedures. Once you’ve downloaded video clips, you can edit them to the most efficient length to get your point across.
Graphs and Charts
If you have numerical data that you want to present, consider using a simple graph or chart. In general, avoid complex charts or tables. You can include the complete data set in your handout if you feel it is necessary.[23]
Particularly when it comes to numerical data, identify the meaning in the numbers and exclude the rest. “Audiences are screaming ‘make it clear,’ not ‘cram more in.’ You won’t often hear an audience member say, ‘That presentation would have been so much better if it were longer’.”[24] In some cases, you can even decide not to use a graph at all and display the one relevant fact that is your conclusion.
Different graphs and charts have different purposes, and it is important to select the one that puts your data in the appropriate context to be clearly understood. Pie charts show how the parts relate to the whole and are suitable for up to eight segments, as long as they remain visually distinct.[25] Use a line graph to show trends over time or how data relates or interacts. Bar charts are good for showing comparisons of size or magnitude and for showing precise comparisons. There are other types of charts and graphs available, but pie charts, line graphs, and bar charts are the most common.
When designing charts, use easily distinguishable colors with clear labels. Be consistent with your colors and data groupings. For clarity, avoid using 3D graphs and charts, and remove as much of the background noise (lines, shading, etc.) as possible.[26] All components of your chart or graph, once the clutter is removed, should be distinct from any background color. Finally, don’t get too complex in any one chart or graph, make sure your message is as clear as possible, and be sure to visually highlight the conclusion you want the audience to draw.
Citation
If you have chosen to use visual aids in your presentation, it is important to give credit where credit is due. Make sure to mention the source of your props if you borrowed them from a person or organization. You should cite the source for all data and images used in your presentation. There are conflicting opinions about whether the source citations should be on the individual slides or at the end of the presentation on a final slide. Including citations throughout the slide deck places the source information adjacent to the relevant text, but it is often so small it’s unreadable. Placing citations at the end of your presentation reduces clutter on the slides and allows the citation information to be larger and more legible. In all cases, refer to your sources when speaking and be able to provide exact citations for anyone interested in your sources. Citing your sources provides credibility to your content and shows you are a professional.
Approaching Slide Design
It is easy to simply open up your slideware and start typing in the bullet points that outline your talk. If you succumb to this temptation, you will likely fall into the traps for which PowerPoint is infamous.
Presentation design experts Garr Reynolds and Nancy Duarte both recommend starting with paper and pen to help you break away from the text-based, bullet-filled slide shows we all dread.[27][28] While that’s one method of approach, you can also work from your speaking outline to remind yourself of your main concepts, and try to keep your visuals as simple as those main concepts. Just don’t let the software lead you into making a mediocre slideshow.
This video talks about how to approach slide design, and briefly recaps slide design concepts.
You can view the transcript for “Create Slides People Will Remember” here (opens in new window).
Here is the video with accurate captions: Create Slides People Will Remember (opens in a new window).
Practice
Once you have decided on which visual aids to use and have prepared them for your presentation, you should practice with them repeatedly. Through practice you will be able to seamlessly incorporate them into your presentation, which will reduce distractions, increase your credibility, and keep the audience’s attention focused on your message. Practice will also help determine the time required for your presentation so you can edit before you speak if necessary. No audience benefits from the speaker looking at the time, admitting how off schedule they are, or rushing through their remaining slides.
No matter which visual aids you have chosen, they should be displayed only when you are ready to talk about them. Otherwise, the audience will spend time reading any text or guessing the meaning of the visual instead of focusing on the presenter’s words. Once used, visuals should also be removed from sight so as not to continue to distract the audience. With slides, you can do that by inserting plain white slides into your slide deck.
In this speech, David JP Phillips explains how to optimize your slide presentation to help your audience focus on your message and get your point across.
You can view the transcript for “How to avoid death By PowerPoint | David JP Phillips | TEDxStockholmSalon” here (opens in new window).
Here is the video with accurate captions: How to avoid death by PowerPoint | David JP Phillips | TEDxStockholmSalon (opens in new window).
- Duarte, Nancy. Resonate: Present Visual Stories that Transform Audiences. Wiley, 2010, p. 178. ↵
- Reynolds, Garr, and Kawasaki, Guy. Presentation Zen. New Riders Pub., 2007. ↵
- Williams, Robin. The Non-designer's Design Book: Design and Typographic Principles for the Visual Novice. Peachpit Press, 2015. ↵
- Kosslyn, Stephen M., and Kosslyn, Stephen Michael. Clear and to the Point: 8 Psychological Principles for Compelling PowerPoint Presentations. Oxford University Press, 2007. ↵
- Mayer, Richard E., and Mayer, Richard E. Multimedia Learning. Cambridge University Press, 2001. ↵
- Reynolds, Garr. Presentation Zen: Simple Ideas on Presentation Design and Delivery, Pearson Education, 2007. ↵
- Williams, Robin. The Non-designer's Design Book: Design and Typographic Principles for the Visual Novice. Peachpit Press, 2015. ↵
- Kadavy, David. Design for Hackers: Reverse Engineering Beauty. Wiley, 2011. ↵
- Williams, Robin. The Non-designer's Design Book: Design and Typographic Principles for the Visual Novice. Peachpit Press, 2015. ↵
- Kadavy, David. Design for Hackers: Reverse Engineering Beauty. Wiley, 2011. ↵
- Kadavy, David. Design for Hackers: Reverse Engineering Beauty. Wiley, 2011. ↵
- Duarte, Nancy. Resonate: Present Visual Stories that Transform Audiences. Wiley, 2010. ↵
- Mayer, Richard E. Multimedia Learning. Cambridge University Press, 2001. ↵
- Tufte, Edward R. The cognitive style of PowerPoint. Graphics Press, 2003. ↵
- Duarte, Nancy. Resonate: Present Visual Stories that Transform Audiences. Wiley, 2010. ↵
- Reynolds, Garr. Presentation Zen: Simple Ideas on Presentation Design and Delivery. Pearson Education, 2007. ↵
- Mayer, Richard E. Multimedia Learning. Cambridge University Press, 2001. ↵
- Reynolds, Garr. Presentation Zen: Simple Ideas on Presentation Design and Delivery. Pearson Education, 2007. ↵
- Tufte, Edward R. The cognitive style of PowerPoint. Graphics Press, 2003. ↵
- Reynolds, Garr. Presentation Zen: Simple Ideas on Presentation Design and Delivery. Pearson Education, 2007, p. 130 ↵
- Kosslyn, Stephen Michael. Clear and to the Point: 8 Psychological Principles for Compelling PowerPoint Presentations. Oxford University Press, 2007. ↵
- Malamed, Connie. Visual Language for Designers: Principles for Creating Graphics that People Understand. Rockport Publishers, 2009. ↵
- Reynolds, Garr. Presentation Zen: Simple Ideas on Presentation Design and Delivery. Pearson Education, 2007. ↵
- Duarte, Nancy. Resonate: Present Visual Stories that Transform Audiences. Wiley, 2010, p 118. ↵
- Duarte, Nancy. Resonate: Present Visual Stories that Transform Audiences. Wiley, 2010 ↵
- Reynolds, Garr. Presentation Zen: Simple Ideas on Presentation Design and Delivery. Pearson Education, 2007. ↵
- Reynolds, Garr. Presentation Zen: Simple Ideas on Presentation Design and Delivery, Pearson Education, 2007. ↵
- Duarte, Nancy. Resonate: Present Visual Stories that Transform Audiences. Wiley, 2010. ↵
